












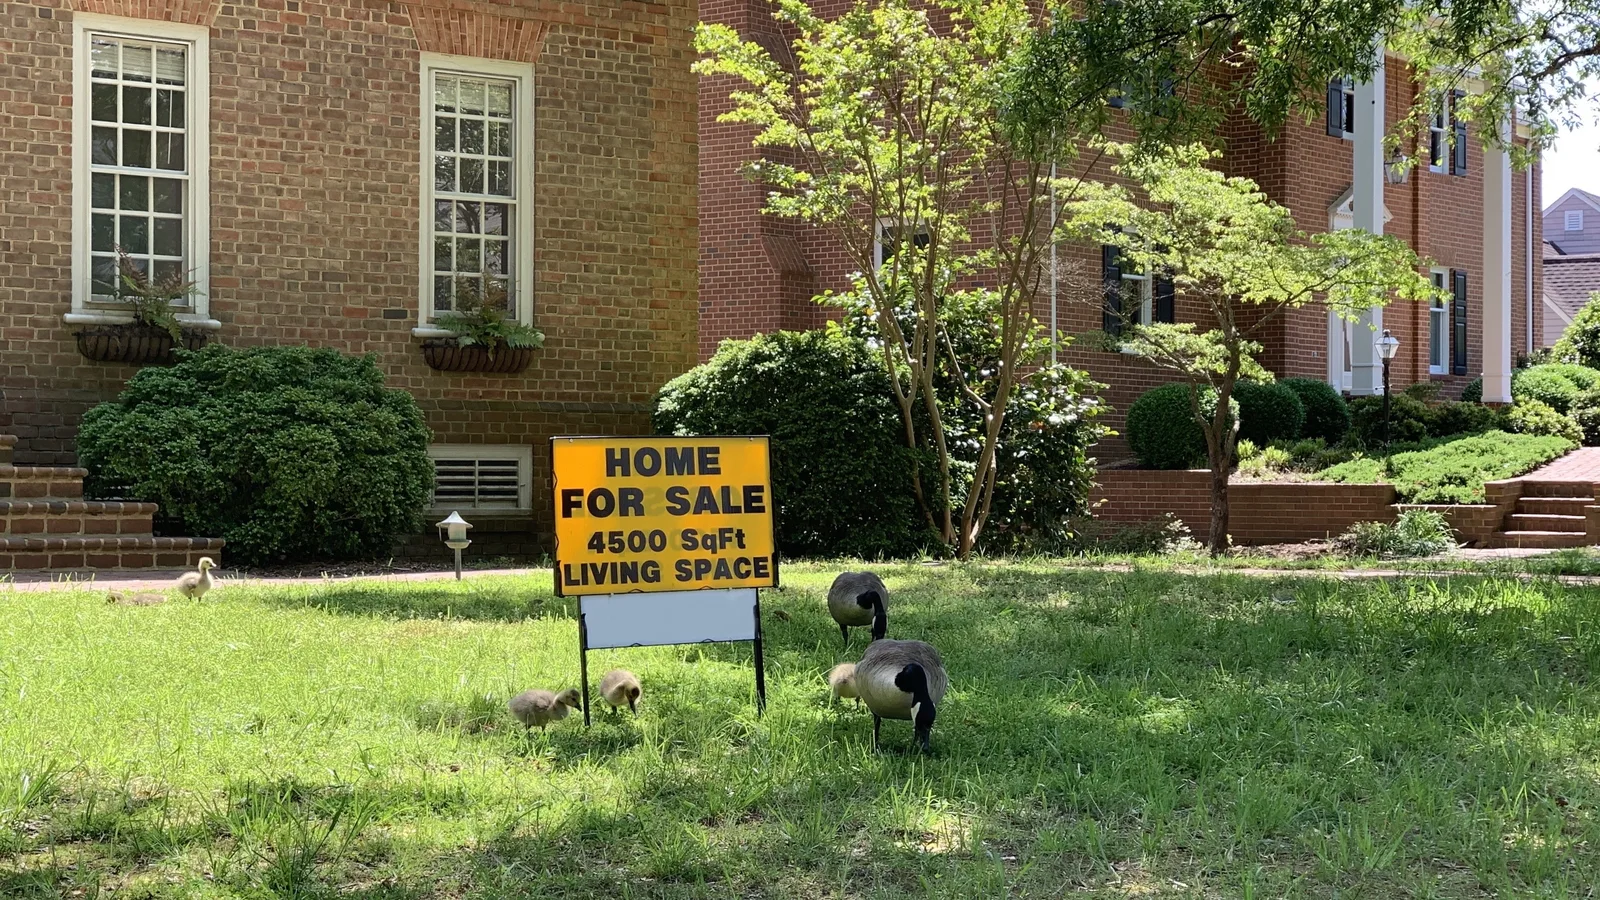
For anyone listing a home this fall, the arithmetic has shifted. Redfin estimates there were about 1,526,984 sellers in the U.S. housing market in October and about 895,752 buyers, which means 70.5 percent more sellers than buyers. That is the widest gap in Redfin's records, which go back to 2013, and it widened from 65.6 percent in September. Redfin published the figures on Nov. 12.
How Redfin counts buyers and sellers
The seller count is the number of active listings on multiple listing services. Buyers cannot be counted directly, so Redfin estimates them from pending sales and from its own data on how long a typical buyer takes to go from a first tour to a closing. Both figures are seasonally adjusted and can be revised. Redfin calls a market a buyer's market when sellers outnumber buyers by more than 10 percent, a seller's market when sellers are more than 10 percent fewer than buyers, and balanced in between.
By that measure the estimated number of buyers fell for a sixth straight month, down 2 percent from September to the lowest level in the series. The number of sellers rose 0.9 percent to the most since March 2020.
Where the balance still favors sellers
Of the 50 most populous metro areas, 41 were buyer's markets in October, matching September's record, and six were balanced: Chicago, Boston, Providence, New Brunswick, New Jersey, Milwaukee and San Francisco. Only three were seller's markets, all in the Northeast:
- Nassau County, New York: about 10,921 buyers and 8,226 sellers.
- Newark, New Jersey: about 7,866 buyers and 6,742 sellers.
- Montgomery County, Pennsylvania: about 6,724 buyers and 5,908 sellers.
Three seller's markets ties the fewest in Redfin's metro records, which start in 2016, matching April 2020. Milwaukee was a seller's market in September and moved to balanced in October. At the other end, Miami had nearly three times as many sellers as buyers, and Nashville and Las Vegas each had about two and a half times as many.
Prices followed the balance. In the three seller's markets, prices rose an average of 3.3 percent from a year earlier; in the buyer's markets the average was 0.3 percent.
What sellers are running into
Redfin's separate October market report, published Nov. 10, shows what a buyer's market looks like from the listing side. Thirty-six percent of homes for sale had at least one price cut, the highest share in Redfin's records. Sixty-one percent of homes that sold went for less than their original list price, and the average sale closed at 96.1 percent of the original asking price. The typical home took 50 days to go under contract, and 14.9 percent of pending deals fell through before closing, up 1.8 percentage points from a year earlier.
The same report puts the average 30-year fixed mortgage rate at 7.33 percent for October, up from 6.86 percent in September, which Redfin cites as the main reason buyers have pulled back.
Using the numbers before you list
National and metro figures describe the market a listing enters, not the price a particular house will bring. The practical questions for a seller are local ones that an agent can answer from closed-sale records: how many comparable homes are listed nearby, how long they have been on the market, how many have cut their price and by how much, and what similar homes actually sold for in the last three months. In a market with more sellers than buyers, those figures tend to matter more than the asking prices on neighboring signs.
Loading comments…